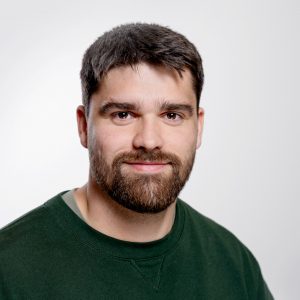
At NERDS we welcome our latest member: Nikos Salamanos!
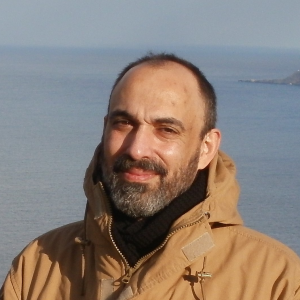 Nikos joins us as postdoctoral researcher, coming from the Cyprus University of Technology, where he was working on applying network analysis to study social media information dissemination.
Nikos will work on an interdisciplinary Villum Synergy project on archaeological data, where he’ll develop network analysis methods to deal with highly biased and incomplete data. The idea is to test how network analysis can aid archaeological research, ultimately applying the newly developed techniques to data retrieved from the remnants of the Roman Empire.
Nikos will be supervised by Michele Coscia and will work jointly with a team of archaeologists led by Tom Brughmans at Aarhus University. Welcome!
 Anders joins us as PhD student, coming from the University of South Denmark, where he was working on machine learning methods.