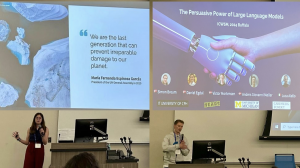
This week, Arianna and Anders are representing NERDS at ICWSM in Buffalo, NY, with two freshly-published papers.
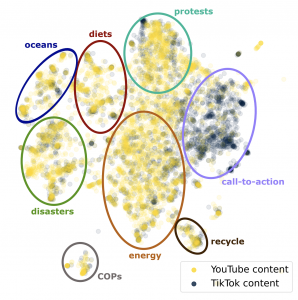
- Narratives of Collective Action in YouTube’s Discourse on Veganism, by A. Pera and L.M. Aiello. ICWSM’24.

We studied vegan narratives on YouTube through the lens of a theoretical framework of moral narratitves. We studied how different narratives elicit different types of responses from video commenters, and found that videos advocating social activism are the most effective at stirring reactions marked by heightened linguistic markers that relate to collective action. - The Persuasive Power of Large Language Models by A.G. Møller and L.M. Aiello. ICWSM’24.
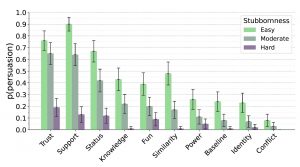
Can artificial agents interact with each other to reproduce human-like persuasive dialogue? And do the arguments they generate sound persuasive to humans? We used Llama2 to test different persuasion strategies, and asked humans to rate them. We found that arguments that included factual knowledge, markers of trust, expressions of support, and conveyed status were deemed most effective according to both humans and agents.


 NERDS
NERDS