
We just published two more papers! Both are on the topic of sustainable mobility:
-
- Growing urban bicycle networks, by M. Szell, S. Mimar, T. Perlman, G. Ghoshal, and R. Sinatra, published in Scientific Reports
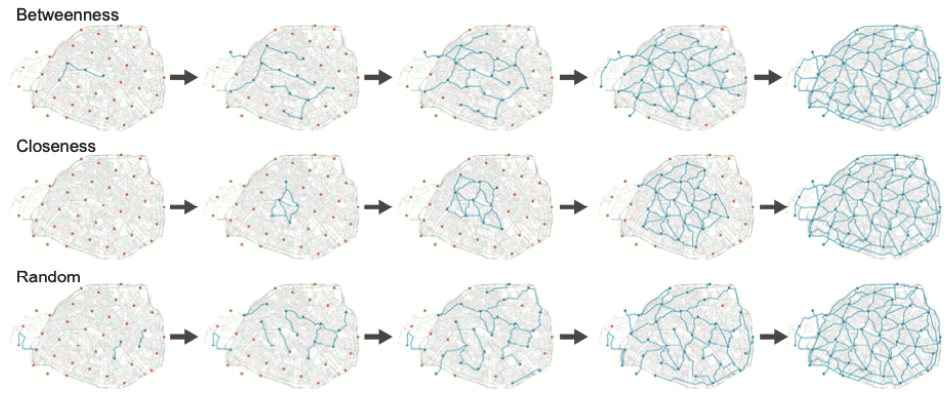
Here we explore systematically the topological limitations of urban bicycle network development. For 62 cities we study different variations of growing a synthetic bicycle network between an arbitrary set of points routed on the urban street network. We find initially decreasing returns on investment until a critical threshold, posing fundamental consequences to sustainable urban planning: Cities must invest into bicycle networks with the right growth strategy, and persistently, to surpass a critical mass. Growing networks from scratch makes our approach a generally applicable starting point for sustainable urban bicycle network planning with minimal data requirements.
The paper comes with an accompanying data visualization: https://growbike.net - Identifying urban features for vulnerable road user safety in Europe, by M. Klanjcic, L. Gauvin, M. Tizzoni, and M. Szell, published in EPJ Data Science
We identify urban features that are determinants of vulnerable road user safety through the analysis of inter-mode collision data across 24 European cities. We observe that cities with the highest rates of walking and cycling modal shares are the safest for the most vulnerable users. Our results suggest that policies aimed at increasing the modal share of walking and cycling are key to improve road safety for all road users.
We explain and motivate our project in this accompanying blogpost (to appear on https://blogs.biomedcentral.com):Identifying urban features for vulnerable road user safety in Europe
Which traffic participants and which urban features are most associated with road deaths? Recently published work in EPJ Data Science explores this question with data from 24 European cities.

Road crashes result in yearly 1.3 million deaths and 2.3 trillion USD of economic damage. Because of this pressing societal issue, the UN has declared in 2015 the global sustainability goal to halve the number of road deaths by 2020. This goal failed: Road deaths keep rising worldwide.
Many cities are wondering how to solve this issue. However, they might not have the full picture because road crash statistics tend to be reported in a victim-centered way: There are detailed statistics on the distributions of victim demographics such as age or gender, but this neglects necessary information for answering two important questions towards better crash prevention: 1) Who causes the crashes? 2) Why do crashes happen?
The first question can be explored via the so-called casualty matrix. It shows the casualties between all combinations of different traffic participants, for example the threat of cars on cars, of cars on pedestrians, or the threat of trucks on cyclists.
As has been previously shown in an impressive data visualization by a Dutch journalist and researcher team, the by far biggest threat to human life on urban streets in the Netherlands is motorized vehicles – cars and trucks – while cyclists and pedestrians are overwhelmingly their victims and harmless. This sounds plausible, but a systematic, quantitative study over multiple countries has been missing.
The second question – Why do crashes happen? – is much harder to answer. Generally crashes happen in an interplay between the individual behaviors of crash participants and their environments.
Environmental features like the extent of pedestrian areas, cycling tracks, or speed limits, are easier to collect than behavioral data, therefore their relation to road user risk could be explored in a straightforward way. And because the environment can be changed or regulated by decision makers, they can be held responsible to act.
To support with evidence such actions towards making cities safer, the OECD recently called for developing a modern approach to road safety: 1) collect and analyze crash data from a larger set of cities, 2) investigate the relationships between urban shape, density, speeds, and road user risk, and 3) analyze casualty matrices.
Inspired by these OECD recommendations and the Dutch data visualization, in our work we collected crash data from 24 cities in 5 European countries with high enough resolution to build and explore casualty matrices, to quantify road safety in a systemic approach, and to identify those urban features that are most relevant, especially for vulnerable road users like pedestrians who are known to be disproportionally impacted.
Exploring the casualty matrices first, we found the same overall picture as our Dutch colleagues, see Fig. 1: Cars are the most substantial hazard. However, we also found considerable local variations. For example, cars are a considerable threat to pedestrians and cyclists in inner London, but this is much less the case in Barcelona.
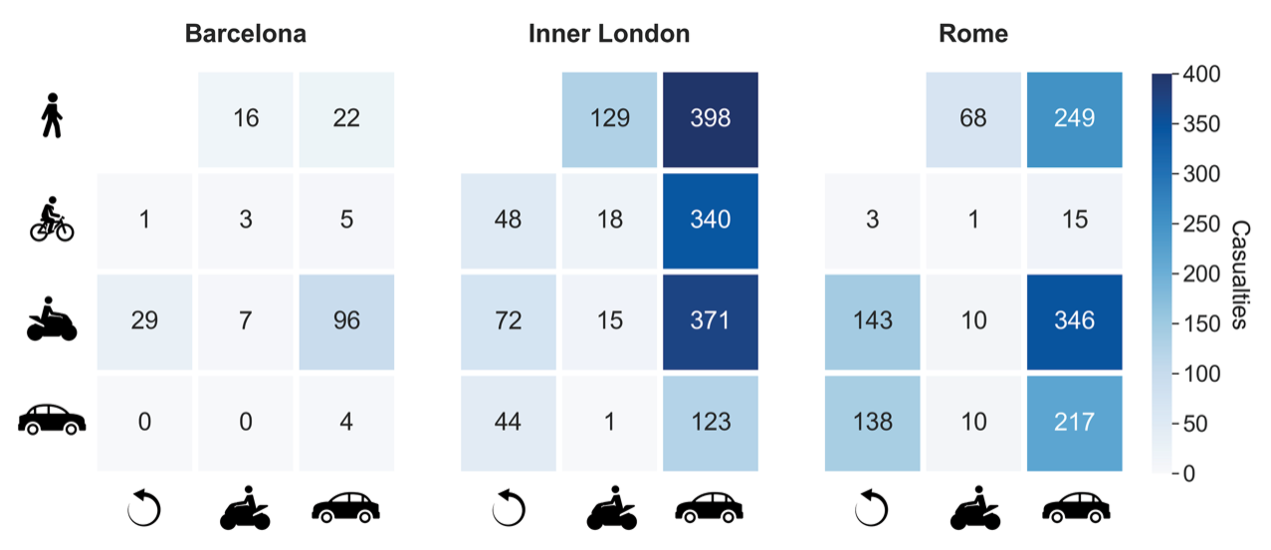 Figure 1: Casualty matrices for 2018 show road deaths and serious injuries after a traffic participant on the left collided with one on the bottom. Cars are responsible for the majority of road deaths/injuries, while columns for pedestrians and cyclists do not appear because they pose practically no risk to others.
When normalizing the number of deaths and serious injuries by population, we found British cities to be most dangerous, while Oslo is by far the least dangerous. This is not surprising given how much Oslo has recently invested into following a Vision Zero strategy, i.e. to aim for zero road fatalities, which they achieved in 2019.
Finally, we set out to answer: What are the urban features most associated with crashes? Here we considered several features acquired from different sources, like OpenStreetMap: population density, the amount of bicycle tracks versus car lanes, the fraction of low-speed-limit streets, the distribution of how people move (walking, cycling, public transport, or motor vehicles), temperature, precipitation, and GDP.
Using an information theory measure to identify the most fitting pairings of these features with road crashes, we found the best significant predictor, see Fig. 2: Cities with more people walking have less road deaths.
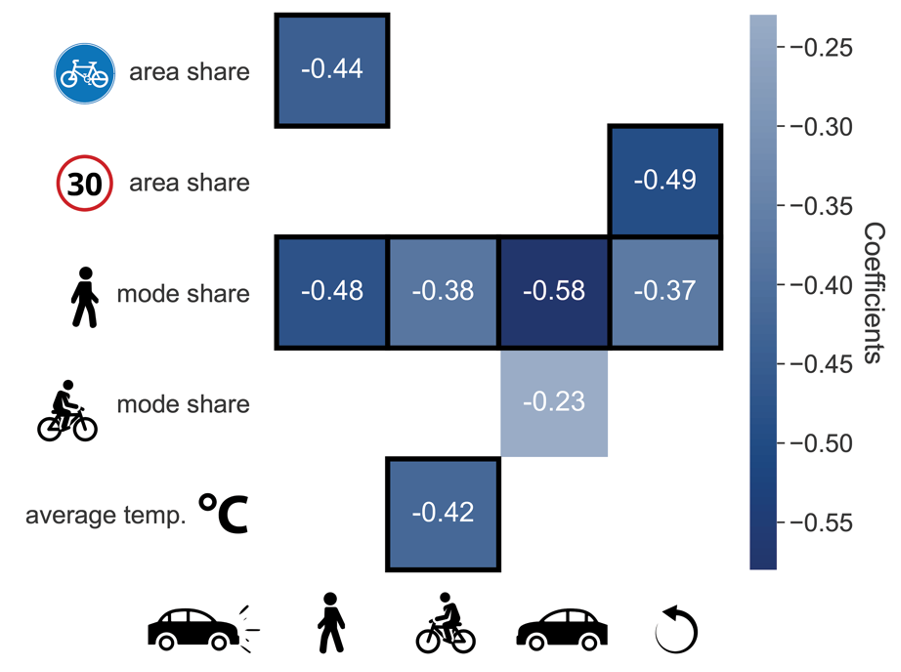 Figure 2: The share of people walking in a city is a significant predictor for less casualties, for any traffic participant killed or seriously injured by a car. Numbers are regression coefficients, black borders denote statistical significance at p < 0.05.
Interestingly, this result extends to all modes of transport: More walking is associated not just with higher pedestrian safety, but also with higher cyclist and motorist safety.
Apart from the share of walking, a similarly strong association with road safety is having more streets limited to at most 30 km/h.
We need to be clear that our results can be only as good as the underlying data, and these can have large reporting biases. For example, crashes with cyclists are often not reported, and different EU countries have different reporting procedures. So, more research and more standardized policies on crash reporting are needed. Also, we only calculated statistical correlations, so we cannot say anything about cause and effect.
Nevertheless, our data-driven conclusions support a modern, evidence-based paradigm of road safety, suggesting this advice to urban decision makers: Make your cities more walkable and remove the hazard of cars. Besides the massive public health benefits, this will make your city more livable and its transport system more sustainable.
- Growing urban bicycle networks, by M. Szell, S. Mimar, T. Perlman, G. Ghoshal, and R. Sinatra, published in Scientific Reports