We welcome the summer with 3 new diverse papers!
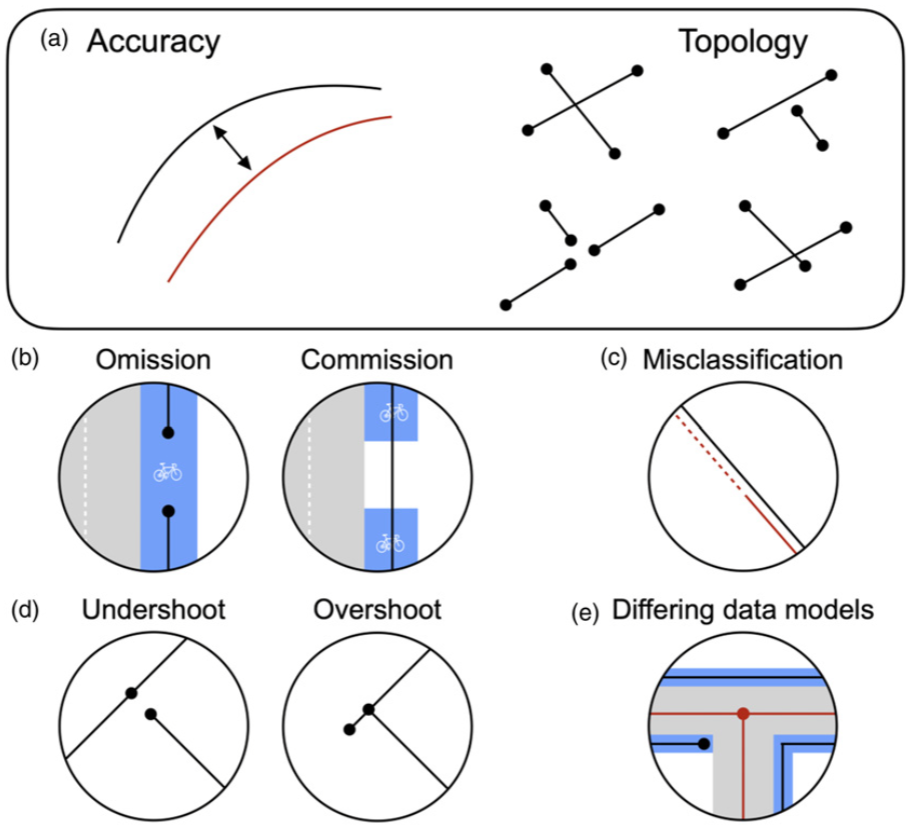
- BikeDNA: A tool for bicycle infrastructure data and network assessment, by A. Rahbek Vierø, A. Vybornova & M. Szell, published in Environment and Planning B

See also: https://github.com/anerv/BikeDNA
Building high-quality bicycle networks requires knowledge of existing bicycle infrastructure. However, bicycle network data from governmental agencies or crowdsourced projects like OpenStreetMap often suffer from unknown, heterogeneous, or low quality, which hampers the green transition of human mobility. In particular, bicycle-specific data have peculiarities that require a tailor-made, reproducible quality assessment pipeline: For example, bicycle networks are much more fragmented than road networks, or are mapped with inconsistent data models. To fill this gap, we introduce BikeDNA, an open-source tool for reproducible quality assessment tailored to bicycle infrastructure data with a focus on network structure and connectivity. BikeDNA performs either a standalone analysis of one data set or a comparative analysis between OpenStreetMap and a reference data set, including feature matching. Data quality metrics are considered both globally for the entire study area and locally on grid cell level, thus exposing spatial variation in data quality. Interactive maps and HTML/PDF reports are generated to facilitate the visual exploration and communication of results. BikeDNA supports quality assessments of bicycle infrastructure data for a wide range of applications—from urban planning to OpenStreetMap data improvement or network research for sustainable mobility. - How Do US Congress Members Advertise Climate Change: An Analysis of Ads Run on Meta’s Platforms, by L. Aisenpreis, G. Gyrst & V. Sekaram published in Proceedings of the International AAAI Conference on Web and Social Media

Ensuring transparency and integrity in political communication on climate change has arguably never been more important than today. Yet we know little about how politicians focus on, talk about, and portray climate change on social media. Here we study it from the perspective of political advertisement. We use Meta’s Ad Library to collect 602,546 ads that have been issued by US Congress members since mid-2018. Out of those only 19,176 (3.2%) are climate-related. Analyzing this data, we find that Democrats focus substantially more on climate change than Republicans, with 99.7% of all climate-related ads stemming from Democratic politicians. In particular, we find this is driven by a small core of Democratic politicians, where 72% of all impressions can be attributed to 10 politicians. Interestingly, we find a significant difference in the average amount of impressions generated per dollar spent between the two parties. Republicans generate on average 188% more impressions with their climate ads for the same money spent as Democrats. We build models to explain the differences and find that demographic factors only partially explain the variance. Our results demonstrate differences of climate-related advertisements of US congress members and reveal differences in advertising characteristics between the two political parties. We anticipate our work to be a starting point for further studies about climate-related ads on Meta’s platforms. - Social dimensions impact individual sleep quantity and quality, by S. Park, A. Zhunis, M. Constantinides, L.M. Aiello, D. Quercia & M. Cha, published in Scientific Reports

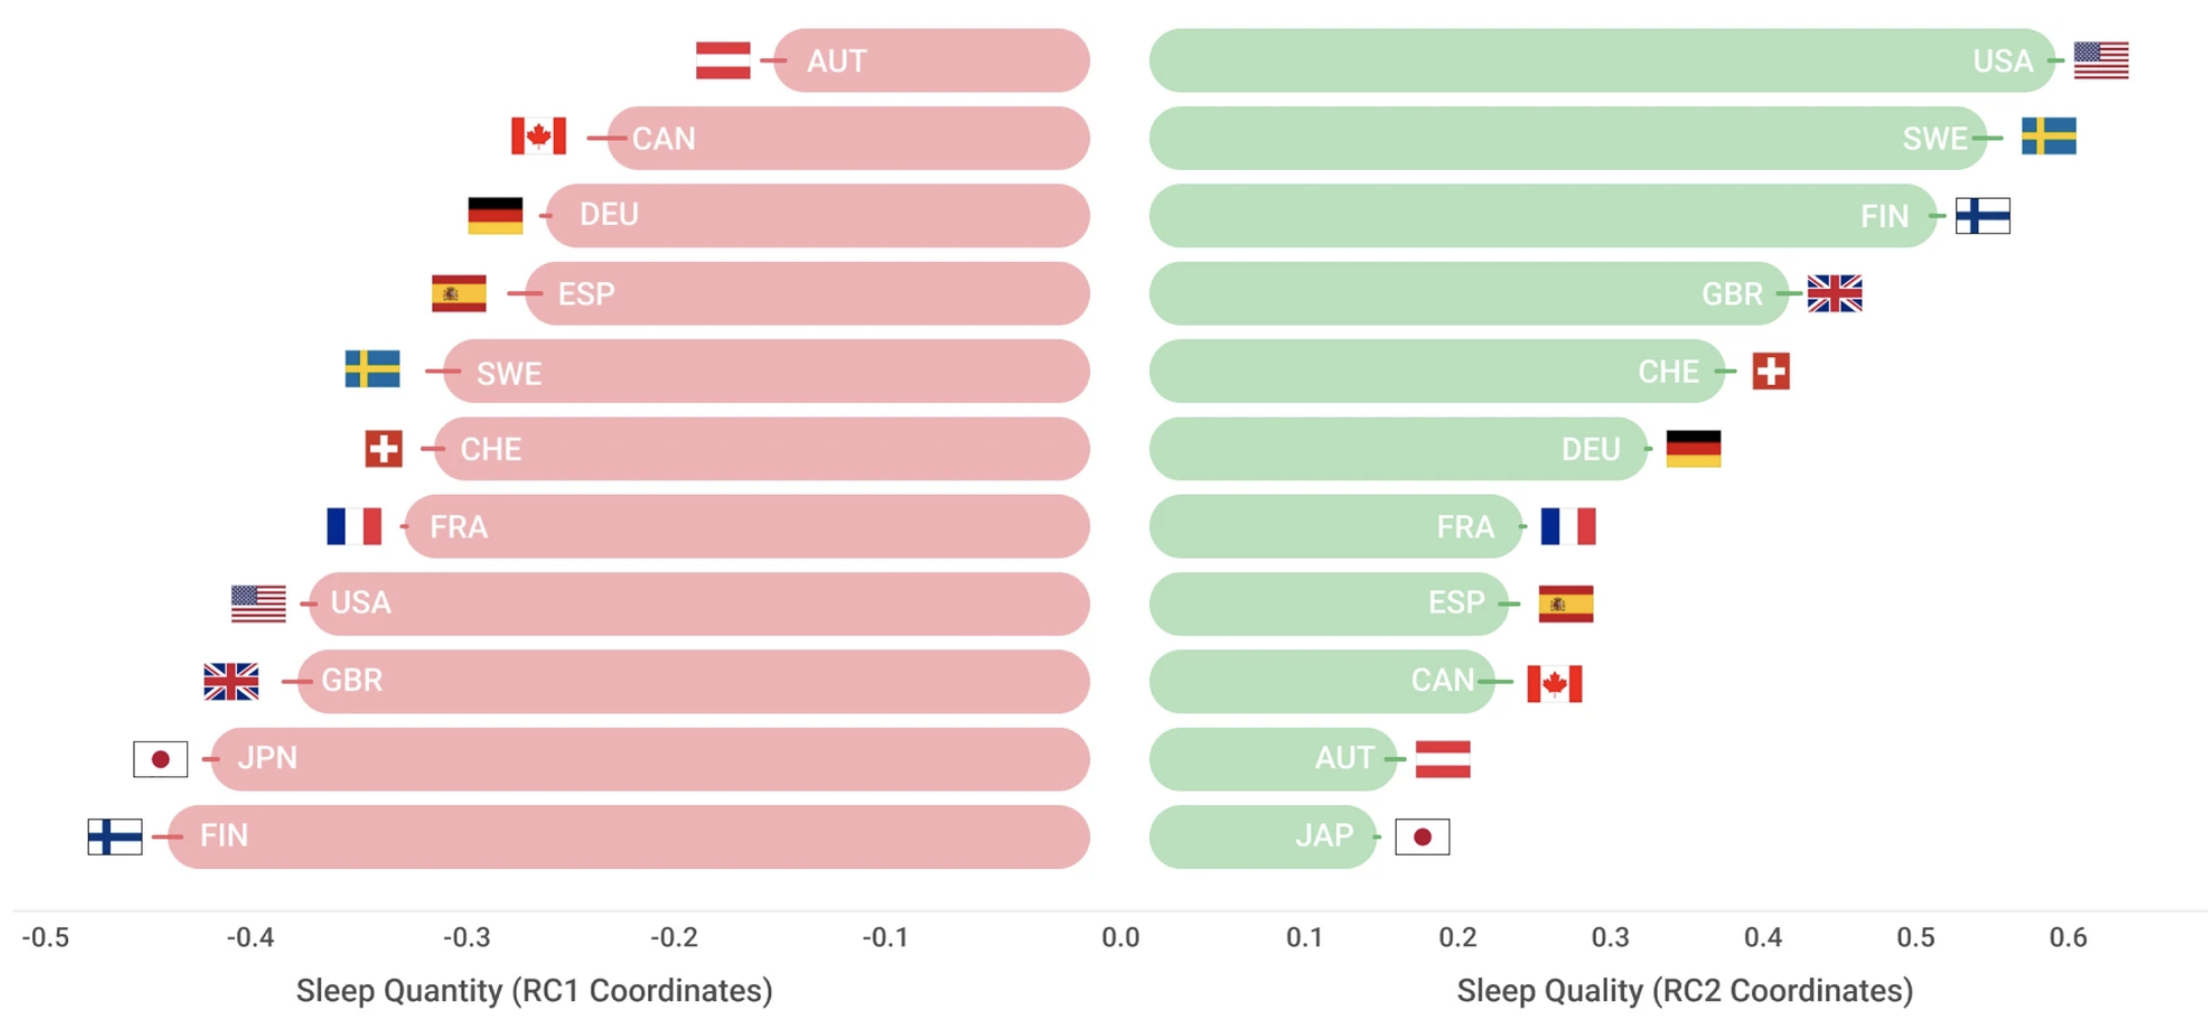
While sleep positively impacts well-being, health, and productivity, the effects of societal factors on sleep remain underexplored. Here we analyze the sleep of 30,082 individuals across 11 countries using 52 million activity records from wearable devices. Our data are consistent with past studies of gender and age-associated sleep characteristics. However, our analysis of wearable device data uncovers differences in recorded vs. self-reported bedtime and sleep duration. The dataset allowed us to study how country-specific metrics such as GDP and cultural indices relate to sleep in groups and individuals. Our analysis indicates that diverse sleep metrics can be represented by two dimensions: sleep quantity and quality. We find that 55% of the variation in sleep quality, and 63% in sleep quantity, are explained by societal factors. Within a societal boundary, individual sleep experience was modified by factors like exercise. Increased exercise or daily steps were associated with better sleep quality (for example, faster sleep onset and less time awake in bed), especially in countries like the U.S. and Finland. Understanding how social norms relate to sleep will help create strategies and policies that enhance the positive impacts of sleep on health, such as productivity and well-being.
