We have three new publications out, on a variety of topics!
- Extracting Participation in Collective Action from Social Media, by Arianna Pera and Luca Maria Aiello, published in Proceedings of the International AAAI Conference on Web and Social Media.
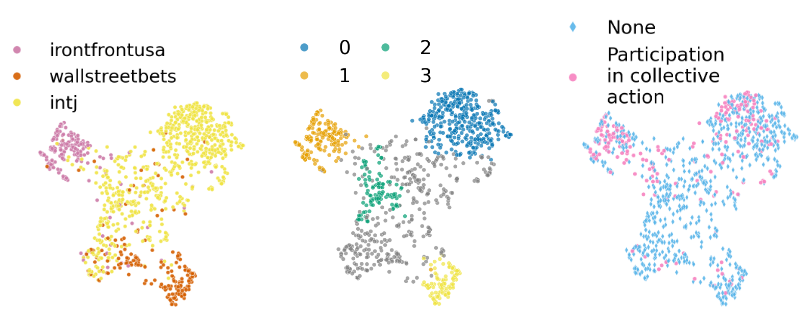
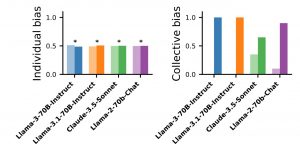
We present a novel suite of text classifiers designed to identify expressions of participation in collective action from social media posts, in a topic-agnostic fashion. Grounded in the theoretical framework of social movement mobilization, our classification captures participation and categorizes it into four levels: recognizing collective issues, engaging in calls-to-action, expressing intention of action, and reporting active involvement. We constructed a labeled training dataset of Reddit comments through crowdsourcing, which we used to train BERT classifiers and fine-tune Llama3 models. Our findings show that smaller language models can reliably detect expressions of participation (weighted F1=0.71), and rival larger models in capturing nuanced levels of participation. - Disruption of outdoor activities caused by wildfire smoke shapes circulation of respiratory pathogens, by Beatriz Arregui-García, Claudio Ascione, Arianna Pera, Boxuan Wang, Davide Stocco, Colin J. Carlson, Shweta Bansal, Eugenio Valdano, Giulia Pullano published in PLOS Climate.
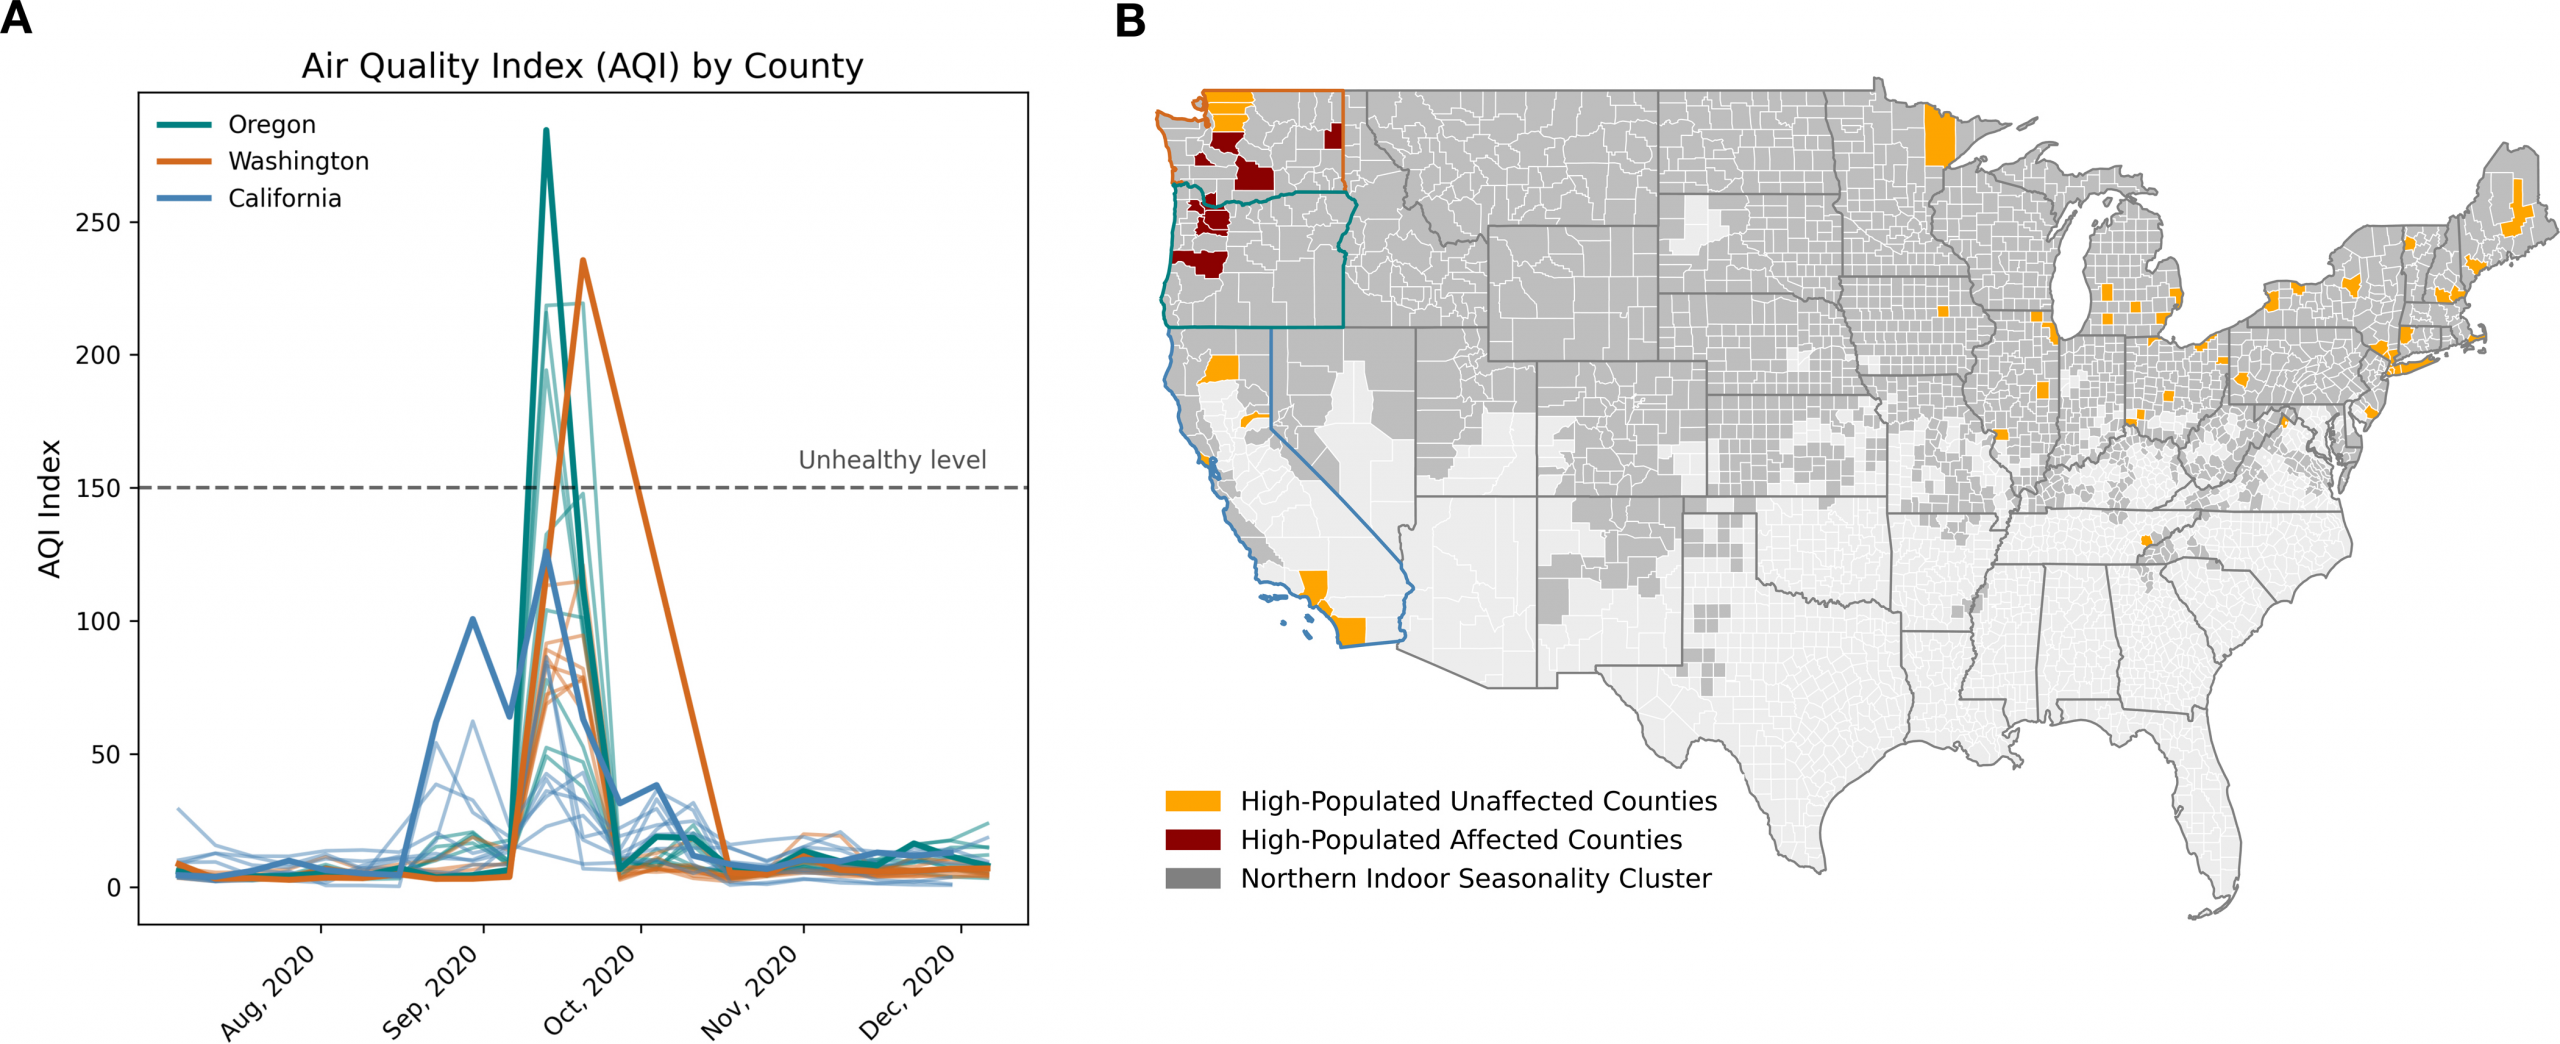
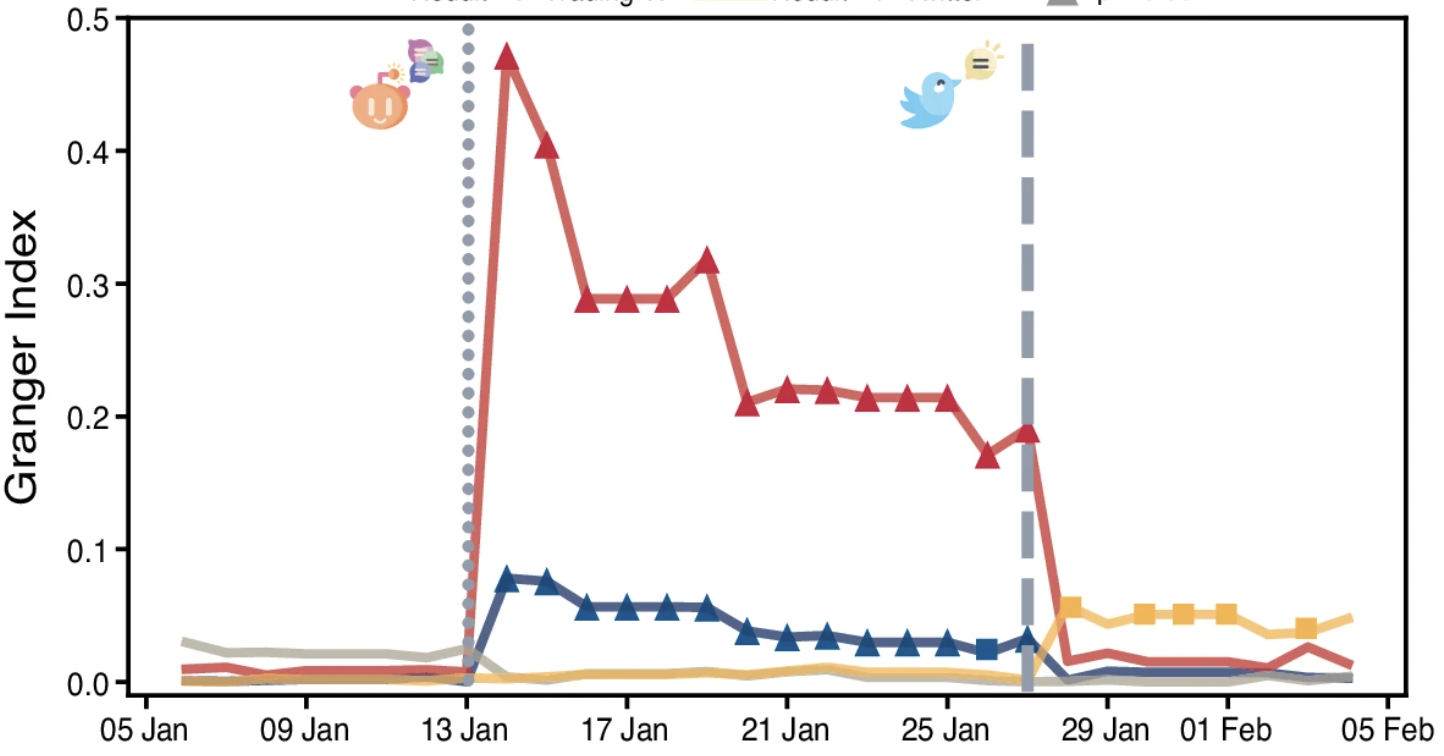
This study investigates how wildfire-induced changes in human behavior during the U.S. West Coast wildfires of 2020 may affect the spread of airborne diseases. Using a mobility data-driven indoor activity index, we find that the wildfire-induced deterioration of air quality led to a substantial increase in indoor activities, fostering conditions conducive to airborne disease transmission. Specifically, counties in Oregon and Washington experienced an average 10.8% and 14.3% increase in indoor activity, respectively, during the wildfire events, with major cities like Portland and Seattle experiencing increases of 11% and 16%, respectively. We quantify these behavioral changes and integrate them into an SIR epidemic model to characterize the increased indoor activity and disease dynamics. The model predicts the greatest impact on diseases with shorter generation times, such as RSV and influenza. - Urban Mobility, by Laura Alessandretti and Michael Szell, book chapter in Compendium of Urban Complexity (Springer)
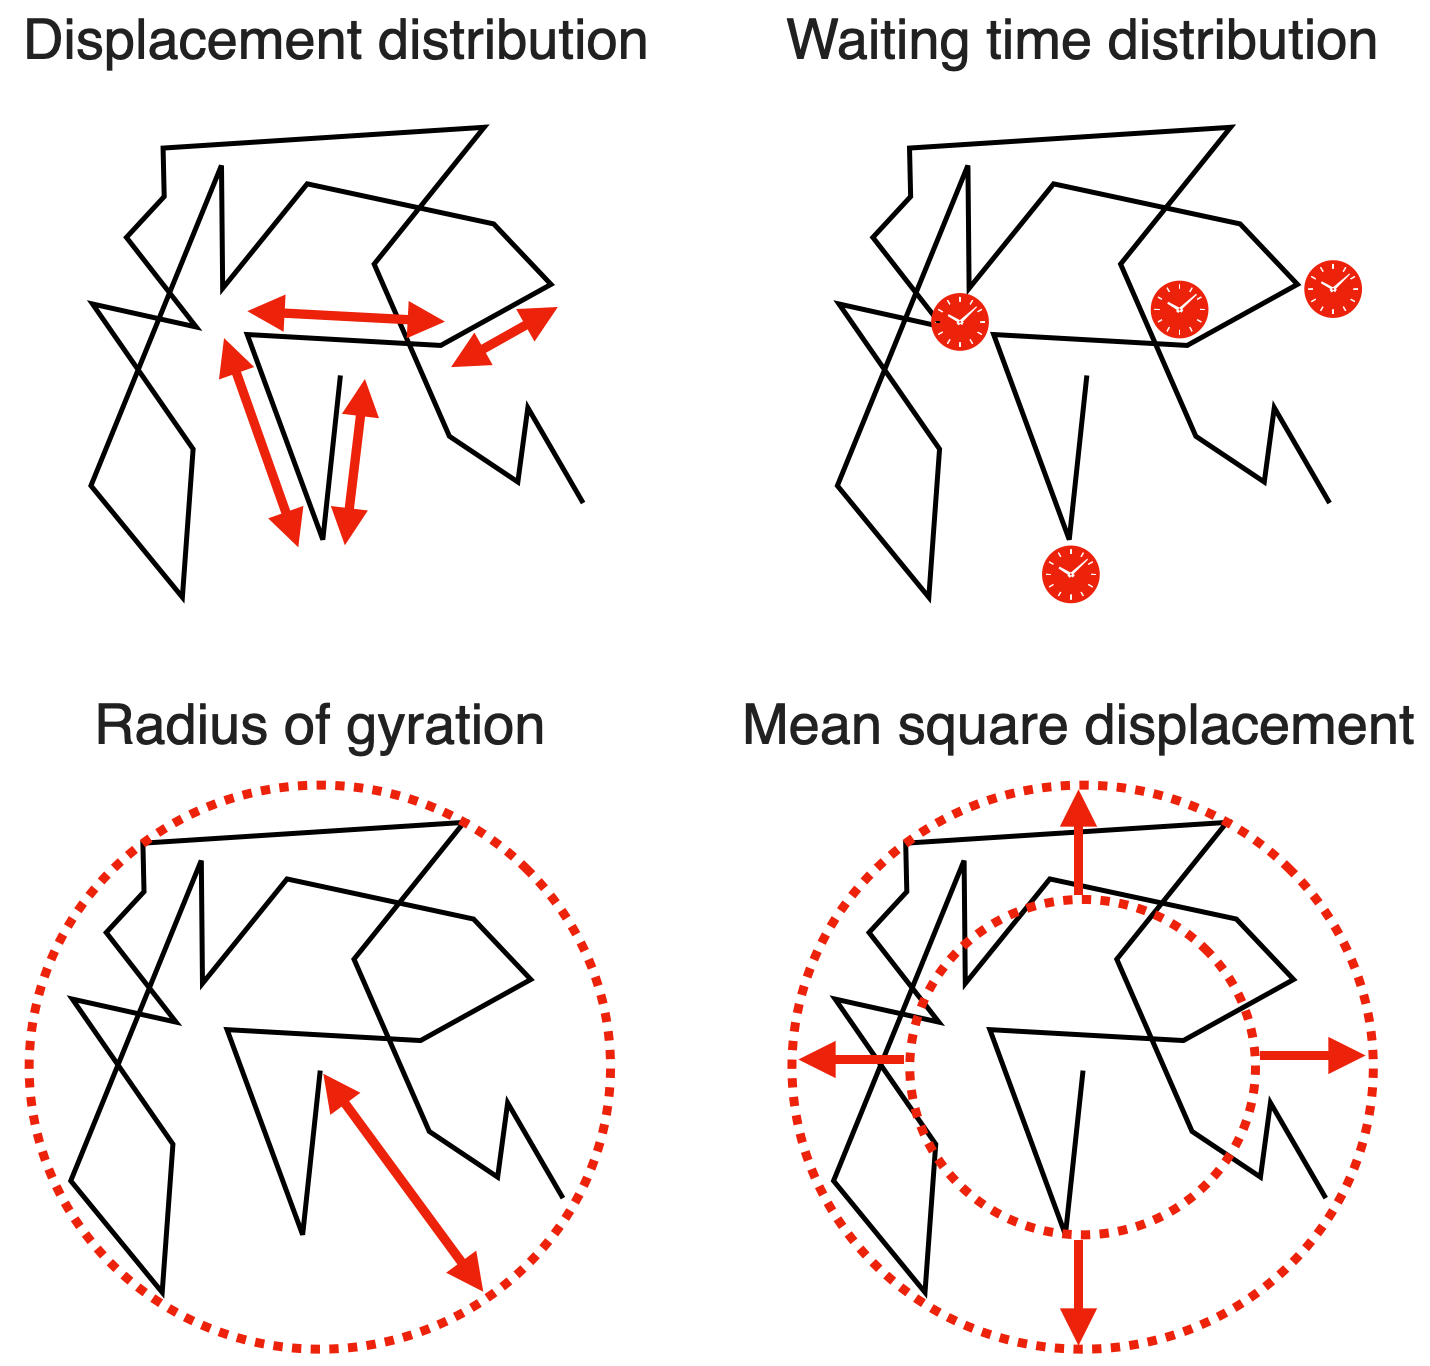
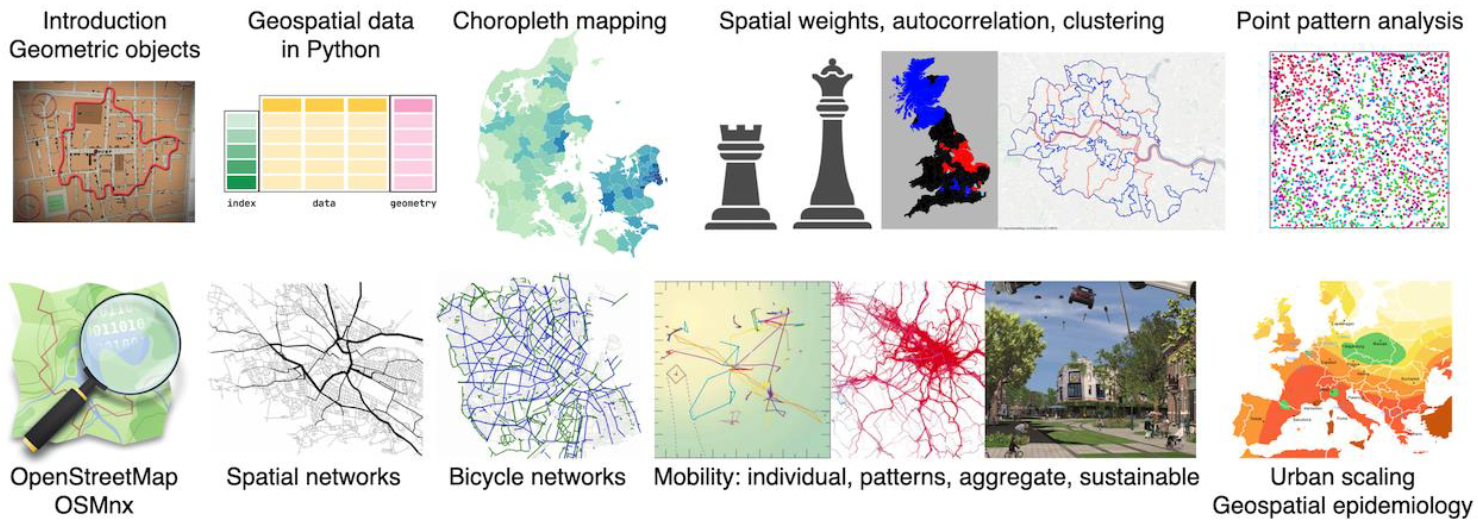
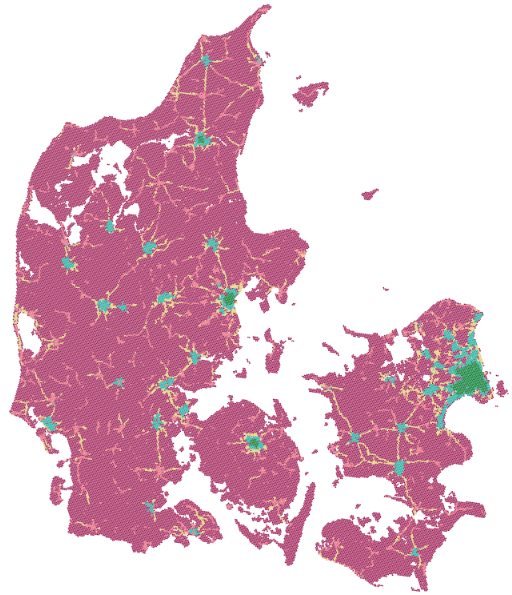
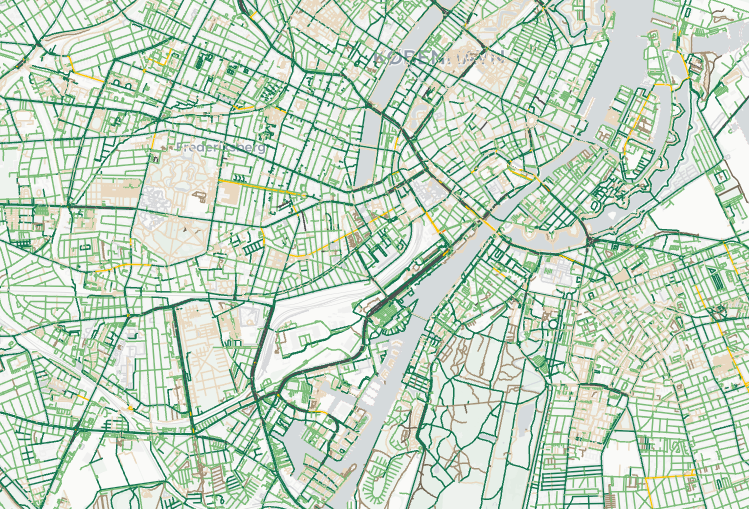
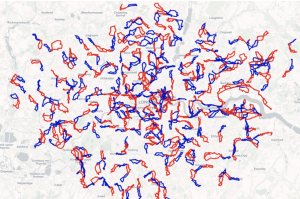
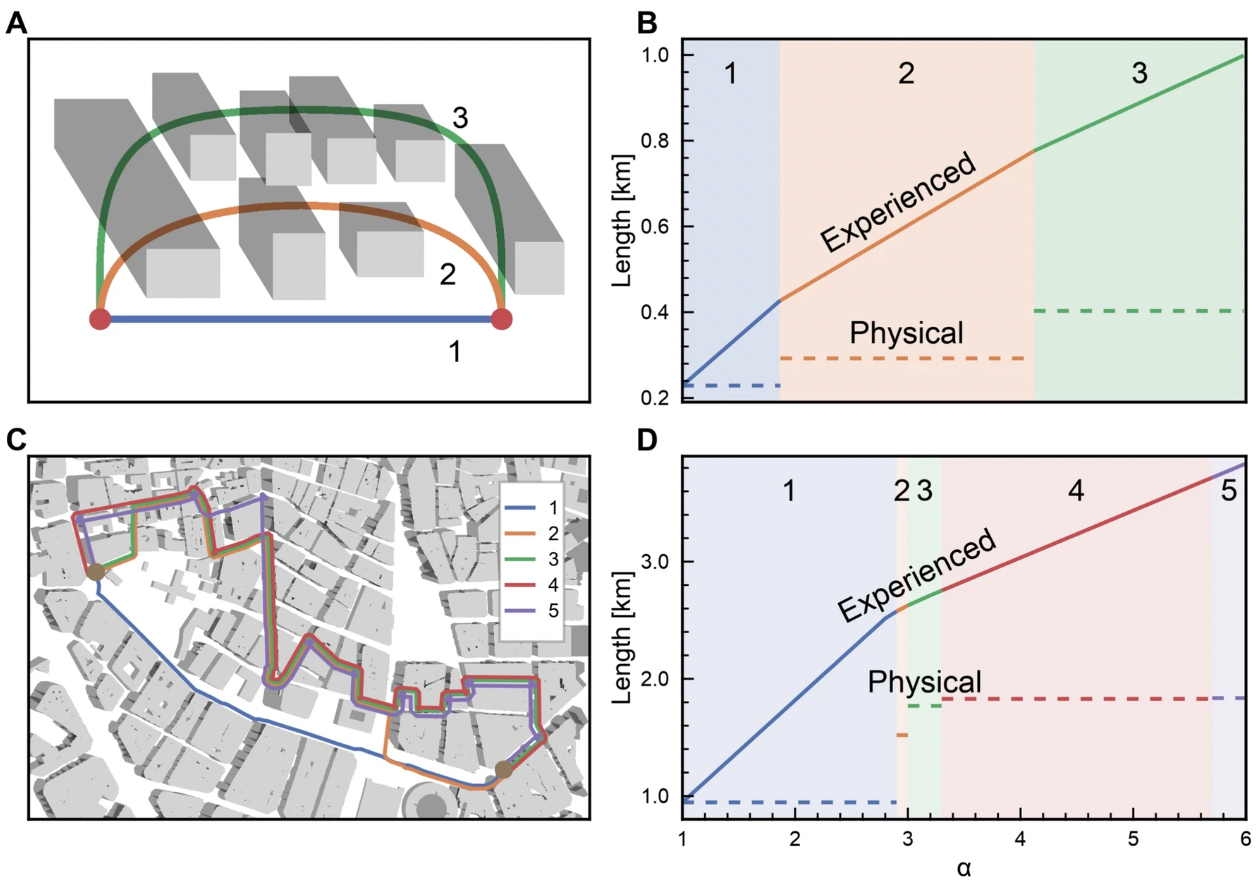
In this chapter, we discuss urban mobility following a complexity science approach. First, we give an overview of the datasets that enable this approach, such as mobile phone records, location-based social network traces, or GPS trajectories from sensors installed on vehicles. We then review the empirical and theoretical understanding of the properties of human movements, including the distribution of travel distances and times, the entropy of trajectories, and the interplay between exploration and exploitation of locations. Next, we explain generative and predictive models of individual mobility, and their limitations due to intrinsic limits of predictability. Finally, we discuss urban transport from a systemic perspective, including system-wide challenges like ridesharing, multimodality, and sustainable transport.
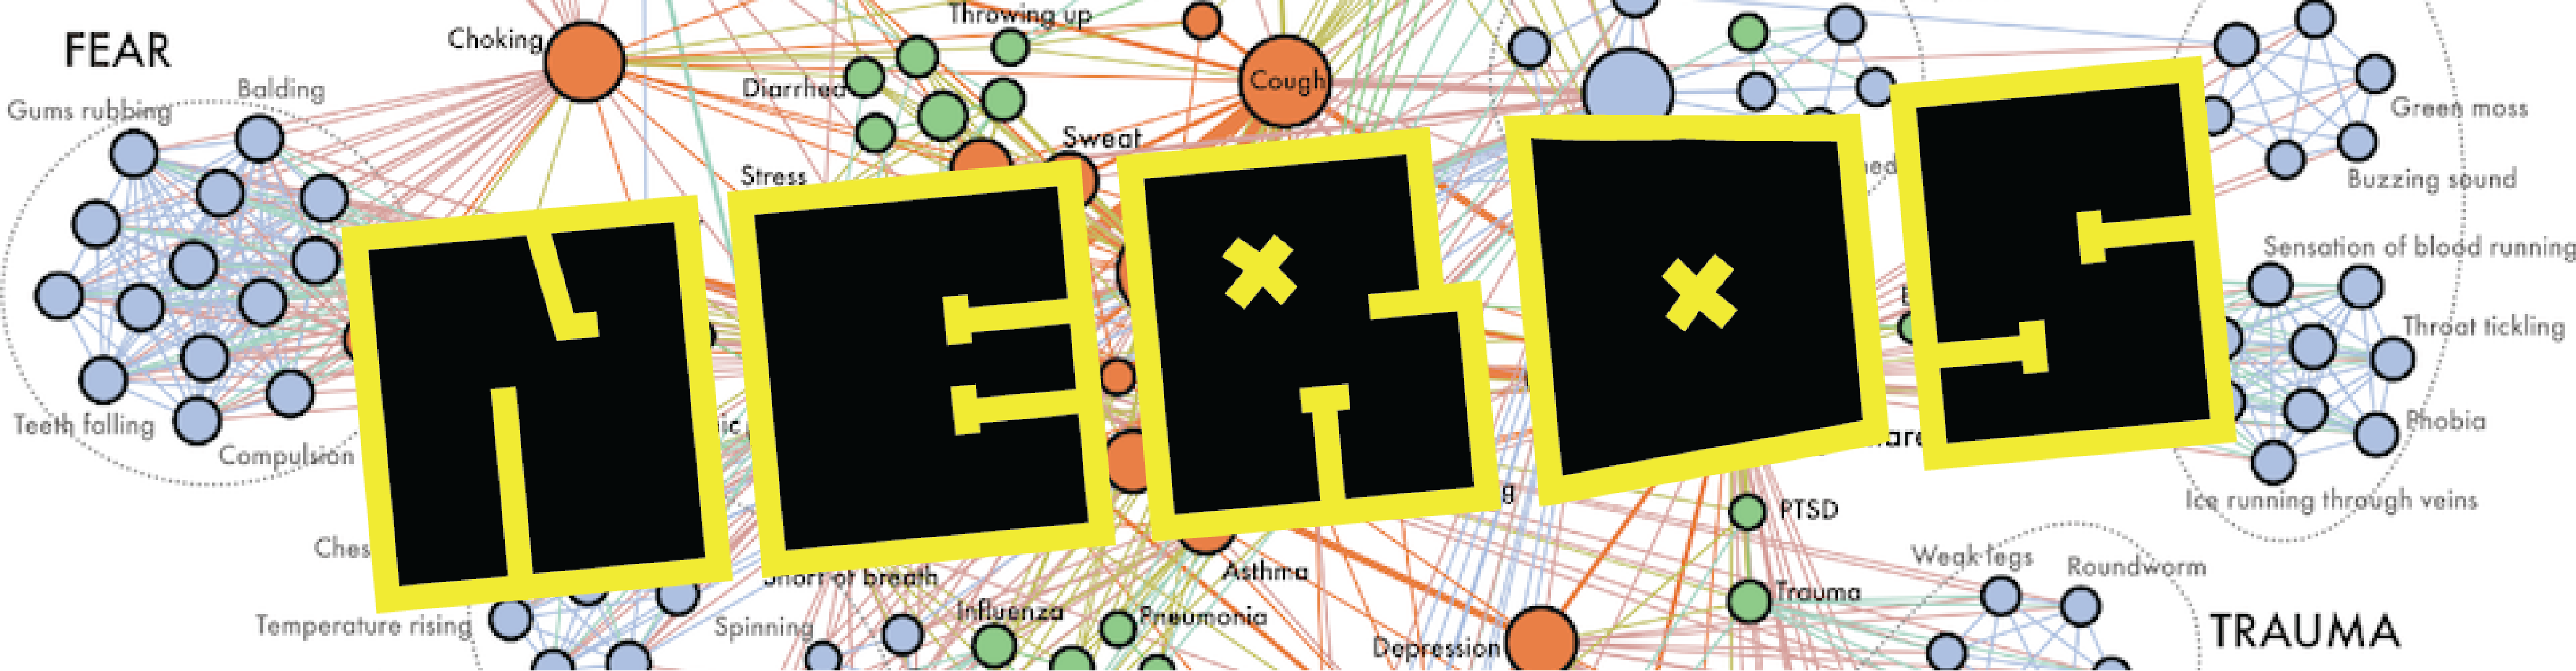
 NERDS member Michele Coscia has updated his textbook for the Network Analysis and Advanced Network Science classes he teaches at ITU. This “Atlas for the Aspiring Network Scientist”, has now reached version 2.0, and 916 pages, and is available for anyone to read for free: